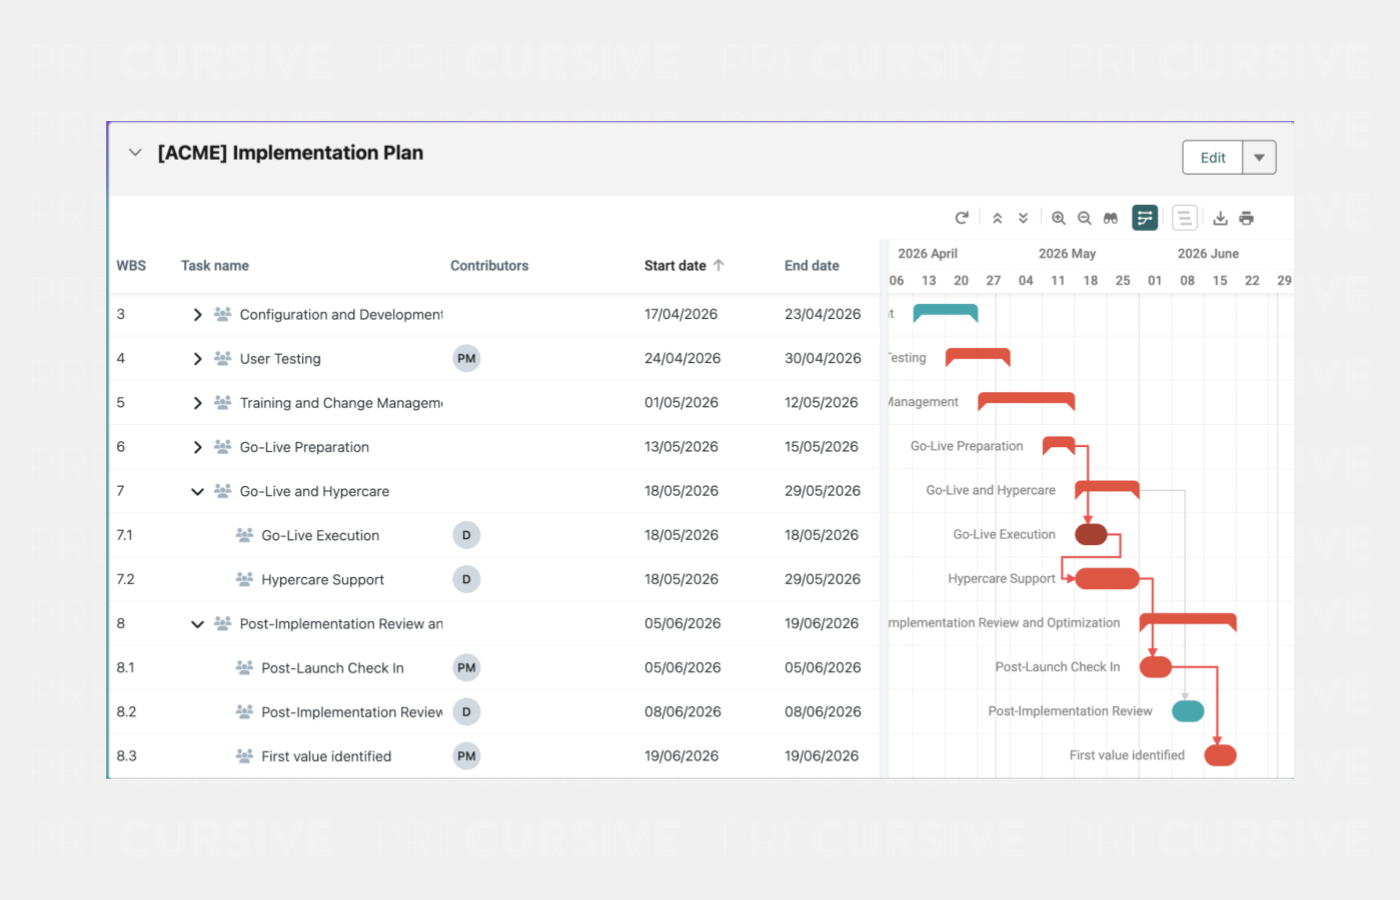
The Gantt provides a visual timeline of the Project Tasks.
With this view you can ✅:
- Display Critical Path
- Manage Task Dependencies by drawing lines between Tasks or inline editing them
- Create Task hierarchies using drag'n'drop
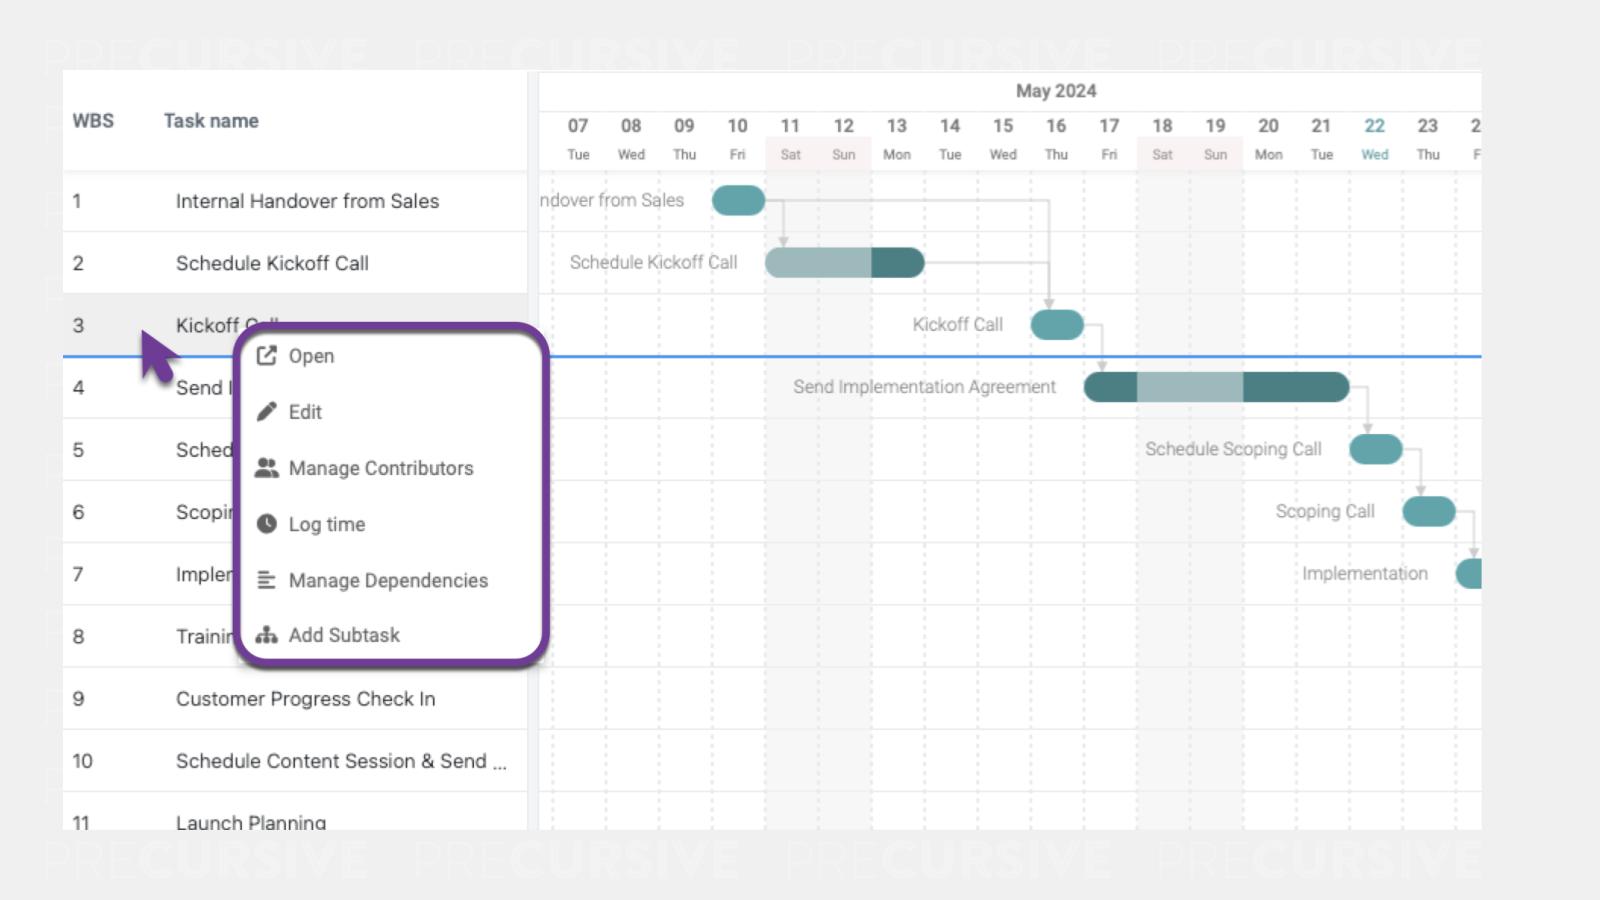
- For each Task (right click):
- Open
- Edit
- Manage Contributors
- Log Time
- Manage Dependencies
- Add Subtask
NOTE: Only Tasks that have Start and End Dates will show in the Gantt View.
Gantt Primary Tab
Quickly access your Project Gantt from the Primary Tabs.
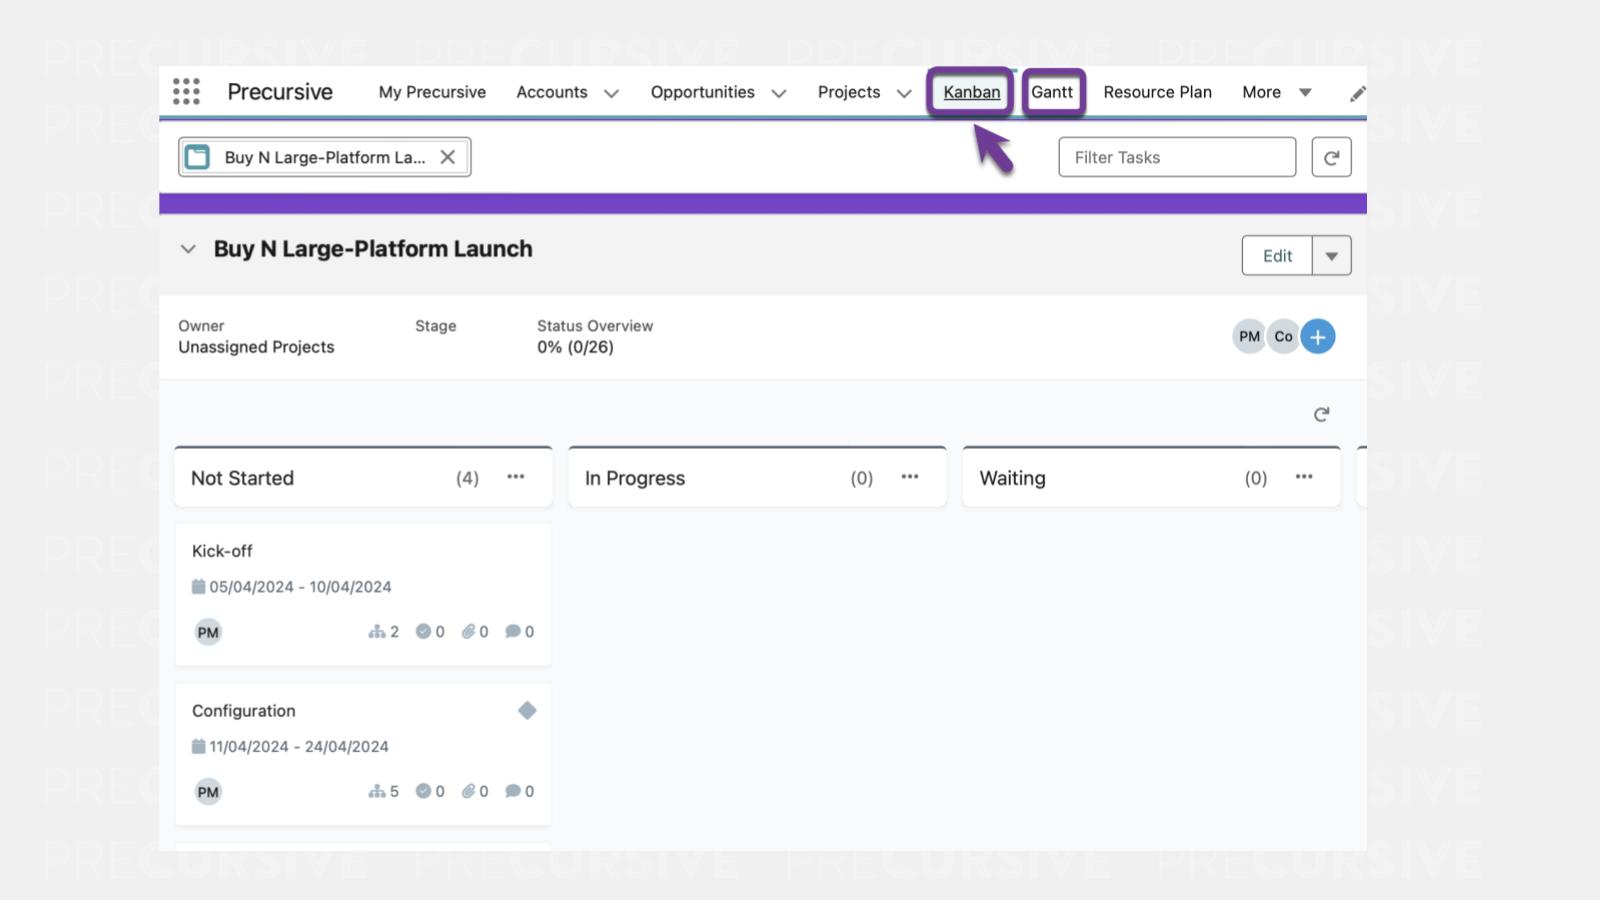
In the Gantt Primary Tabs, you can ✅:
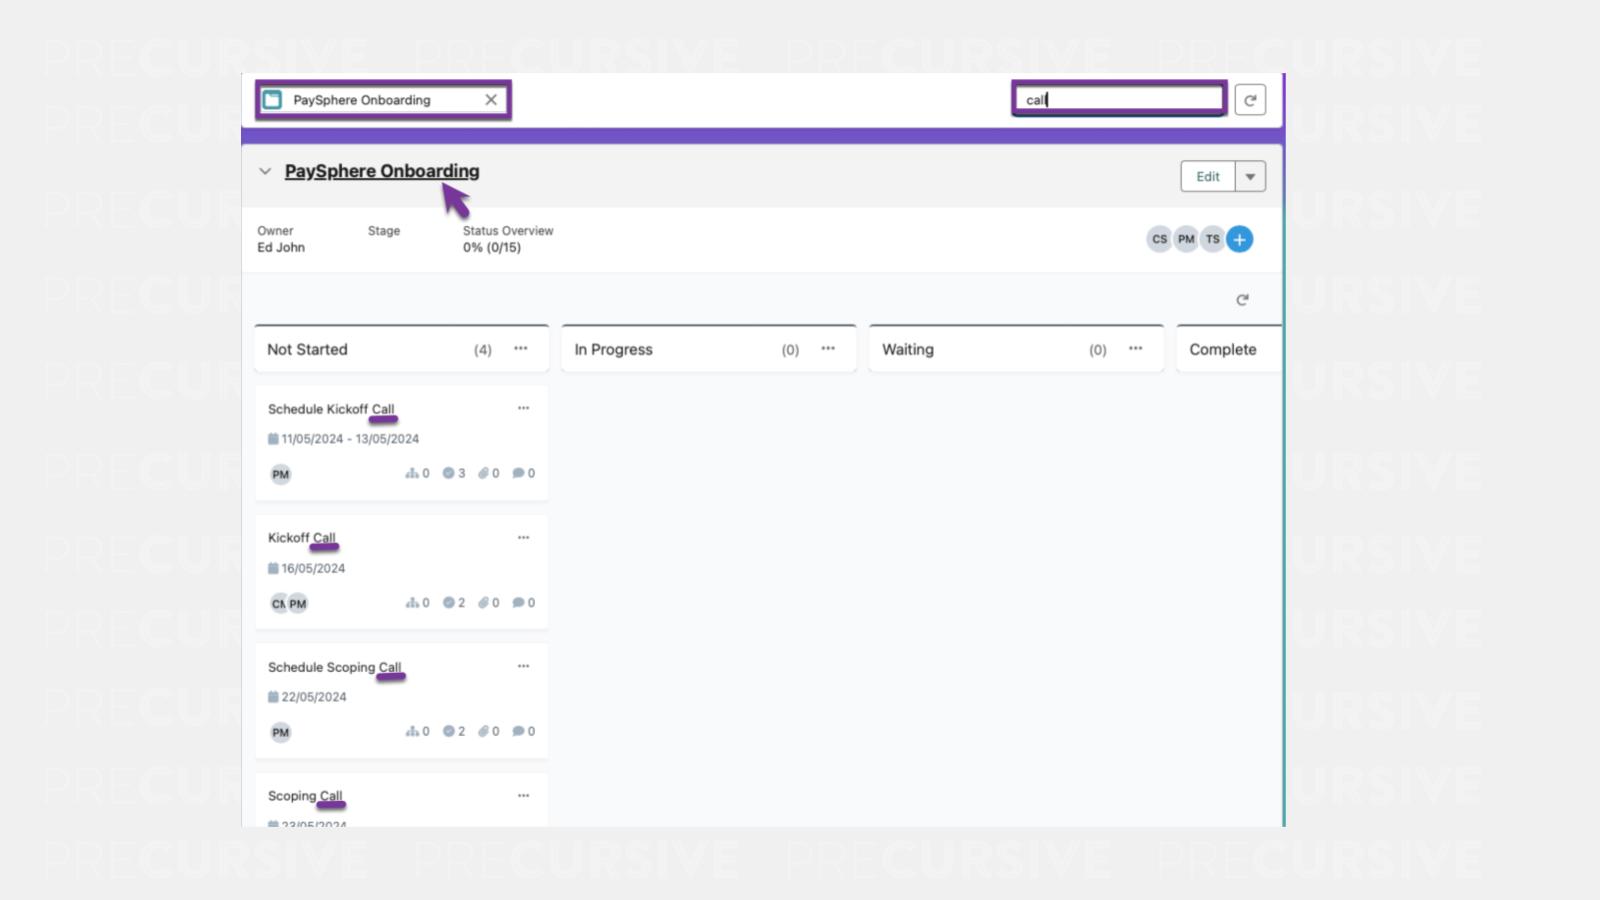
- Search and easily navigate to recently viewed projects
- Filter Tasks in the upper right corner to search for keywords across the List of Tasks
- Navigate to the Phase Level of the Project by clicking on the Phase name
NOTE: Your Salesforce Admin can customize the fields in the Phase Header section. To update these fields, go to Setup, navigate to Object Manager, select Phase, then Field Sets, and choose Phase Header. From there, pick the fields you want to appear in the Phase Header.
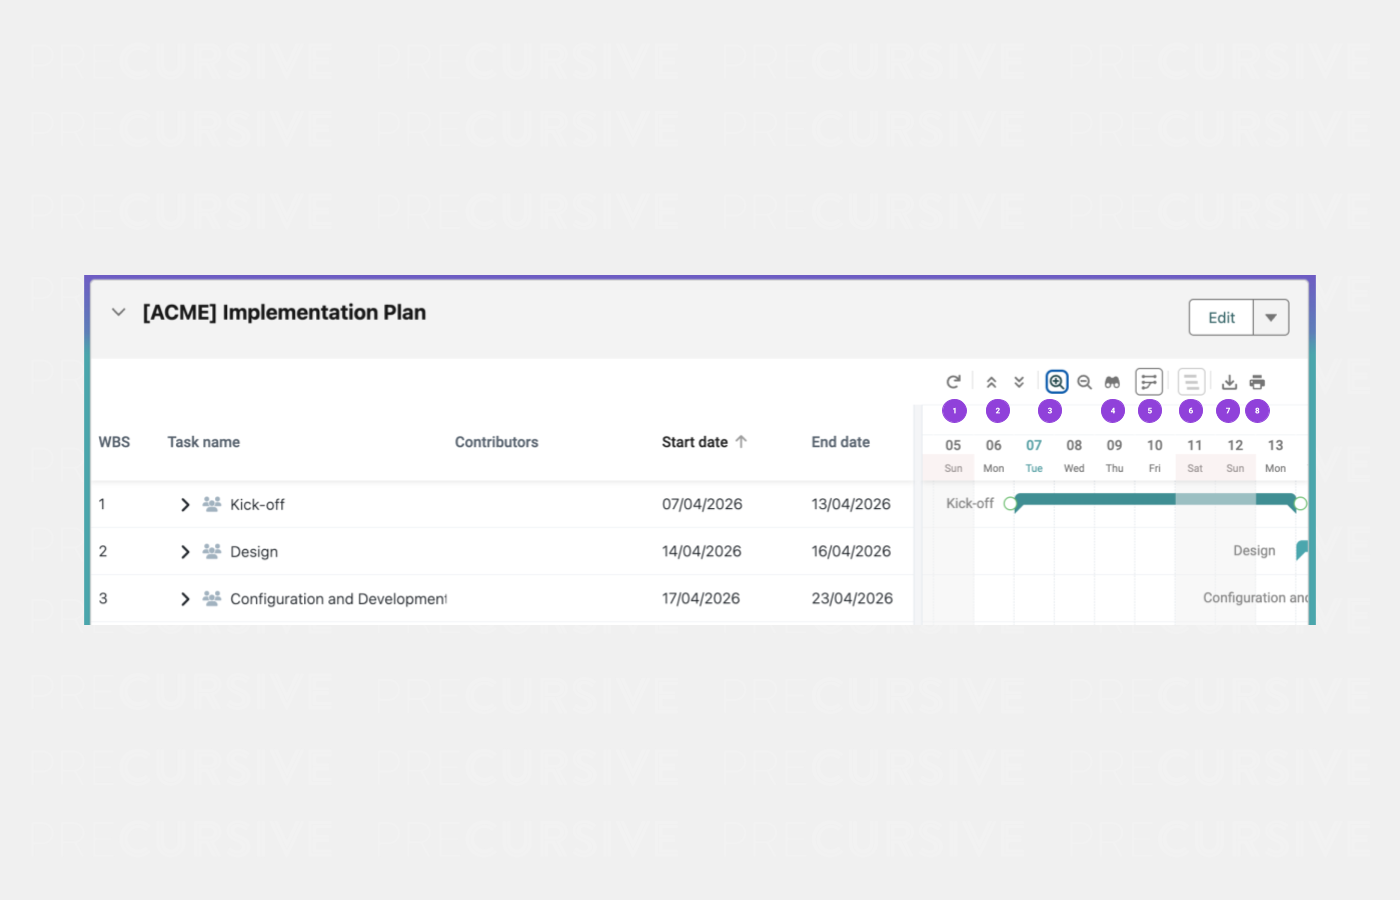
Gantt Timeline Controls
The timeline controls in Gantt allow you to view your Tasks in greater detail.
Using the timeline controls you can:
- Refresh the view
- Collapse / Expand All
- Zoom Timeline In / Out
- Zoom to Fit
- Show Critical Path
- Show Baseline
- Export to Excel
- Print
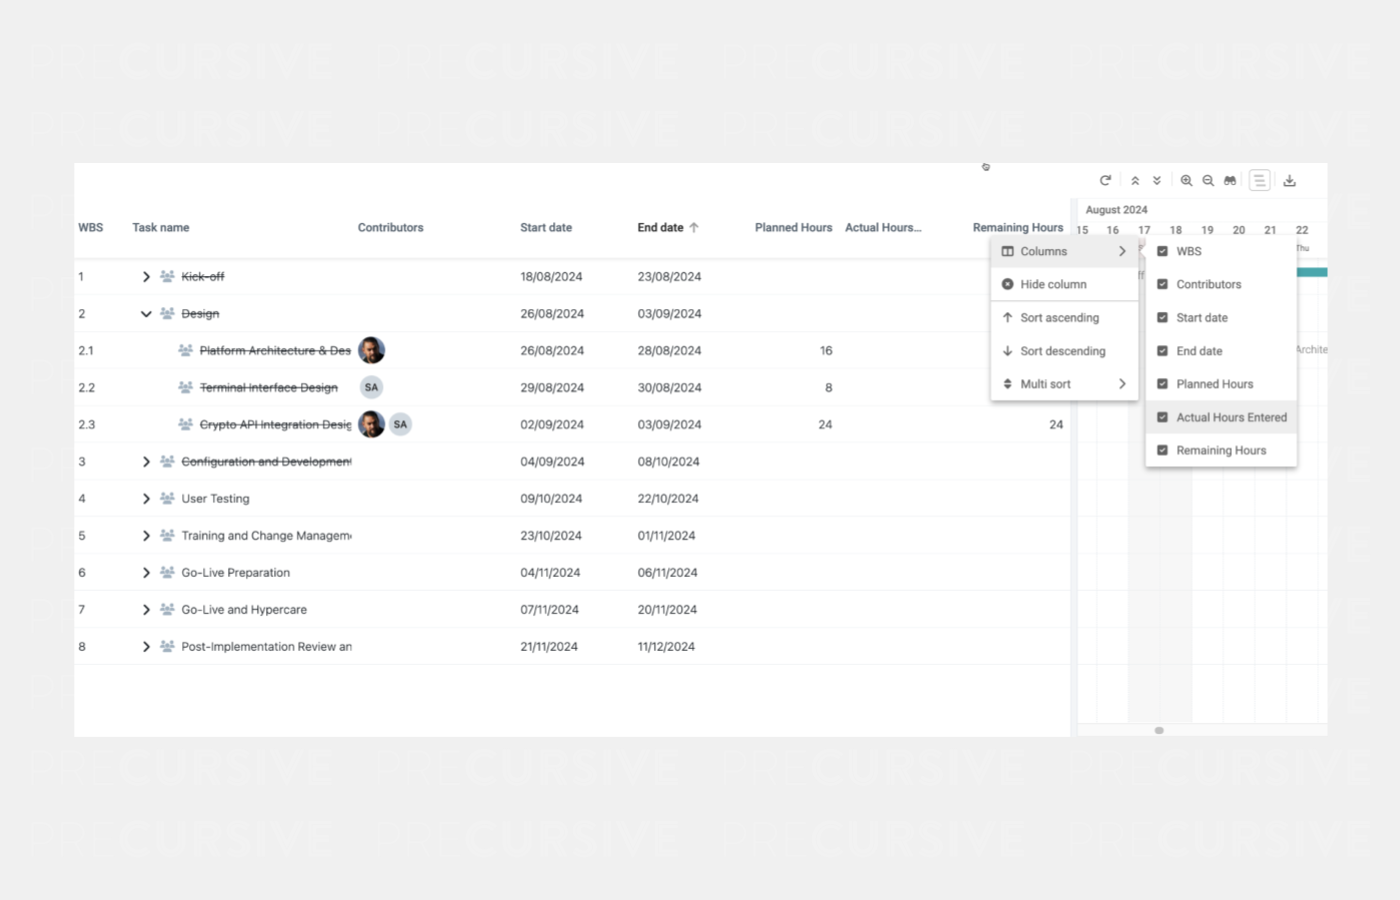
Customizing Gantt Chart Columns
The Gantt chart offers flexibility to tailor the displayed information to suit individual workflows. Administrators have the ability to define which task fields are available for users to display by configuring the "Columns on Gantt" Task Field Set. Up to 10 fields can be added to this set, ensuring that only the most relevant data points are accessible.
Once the field set is configured, each user can personalize their Gantt chart view. Users can choose which columns to show or hide based on their preferences and can also rearrange the order of the columns to align with their workflow. This customization empowers teams to focus on the most critical project details, improving efficiency and project visibility.
- Column Settings: Open the Gantt chart and right-click on the column header. Choose which fields to display or hide from the list defined by the administrator.
- Reorder Columns: Drag and drop columns to arrange them in your preferred order.
This flexible setup ensures that every user can adapt the Gantt chart to highlight the information most relevant to their role and tasks.
Inline Edit Dependencies
Predecessor and Successor columns can be enabled. They allow users to create, update, and remove Task Dependencies inline. Dependencies are entered using WBS (Work Breakdown Structure) number keys.
Critical Path
When Critical Path is enabled, Precursive highlights the longest sequence of dependent Project Tasks that determines the minimum Phase duration. It means that all Tasks that can not be delayed by a day, that are in Dependency chain impacting the last Project Task's End Date will be highlighted along with their Dependency lines, helping you identify early delays that can make a significant difficulties later.
The Critical Path recalculates automatically when Task dates or Dependencies change. Calculations respect the org-wide work schedule configuration.